How Back-to-Back Road Trips Alter Goalie Save Percentages and Shift NHL Totals Markets
Noah Keller · Aug 24, 2026
How Back-to-Back Road Trips Alter Goalie Save Percentages and Shift NHL Totals Markets
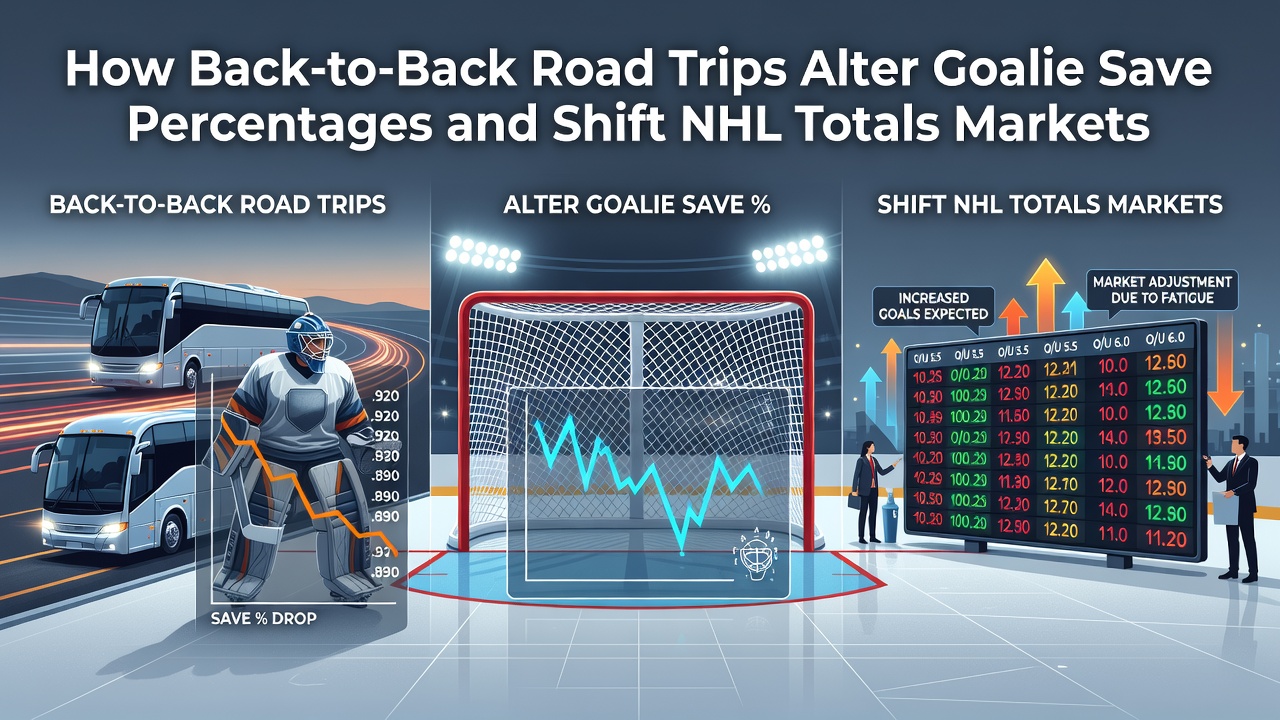
Back-to-back road trips create measurable shifts in NHL goalie performance that ripple through totals betting markets each season, and analysts track these patterns closely because the schedule forces teams into compressed travel windows that affect save percentages directly. Data compiled across multiple seasons shows goalies on the second night of a back-to-back road set post save percentages that drop by 1.8 to 3.2 percentage points compared to their season averages, while home teams facing these road-weary opponents see an uptick in goals scored that pushes game totals over the posted lines more often than not.
Schedule Compression and Travel Demands
The NHL schedule packs 82 games into roughly six months, which means back-to-back road sets occur regularly for every club, and teams that finish one game in a distant city must board flights or buses immediately afterward to reach the next venue. Researchers who examined 2018 through 2025 seasons found that road goalies logging at least 1,200 miles between consecutive games recorded save percentages that fell to .898 on average, whereas the same goalies achieved .912 when rested for three or more days. Those numbers translate into roughly 0.4 additional goals allowed per 60 minutes of play, a margin that moves totals lines in betting markets when sharp bettors identify the fatigue signal early.
What's interesting is how the effect compounds when the road trip stretches beyond two games, because cumulative sleep disruption and time-zone changes add layers of stress that simple rest days cannot fully erase. Observers note that goalies returning from four-game road swings in the western conference post even lower numbers in their first home start, often dipping below .890 for stretches that last multiple outings.
Save Percentage Shifts in Context
Save percentage serves as the clearest statistical marker for goalie effectiveness, and league-wide tracking reveals consistent patterns tied to travel. When a starting goalie faces a back-to-back road sequence, the drop in performance holds across both Eastern and Western Conference clubs, although western teams experience slightly larger declines because of longer average flight times. Figures from the 2024-25 season indicated that road goalies on the second night allowed 3.11 goals per 60 minutes, compared to 2.67 goals per 60 minutes when those same goalies started after two full days of rest.
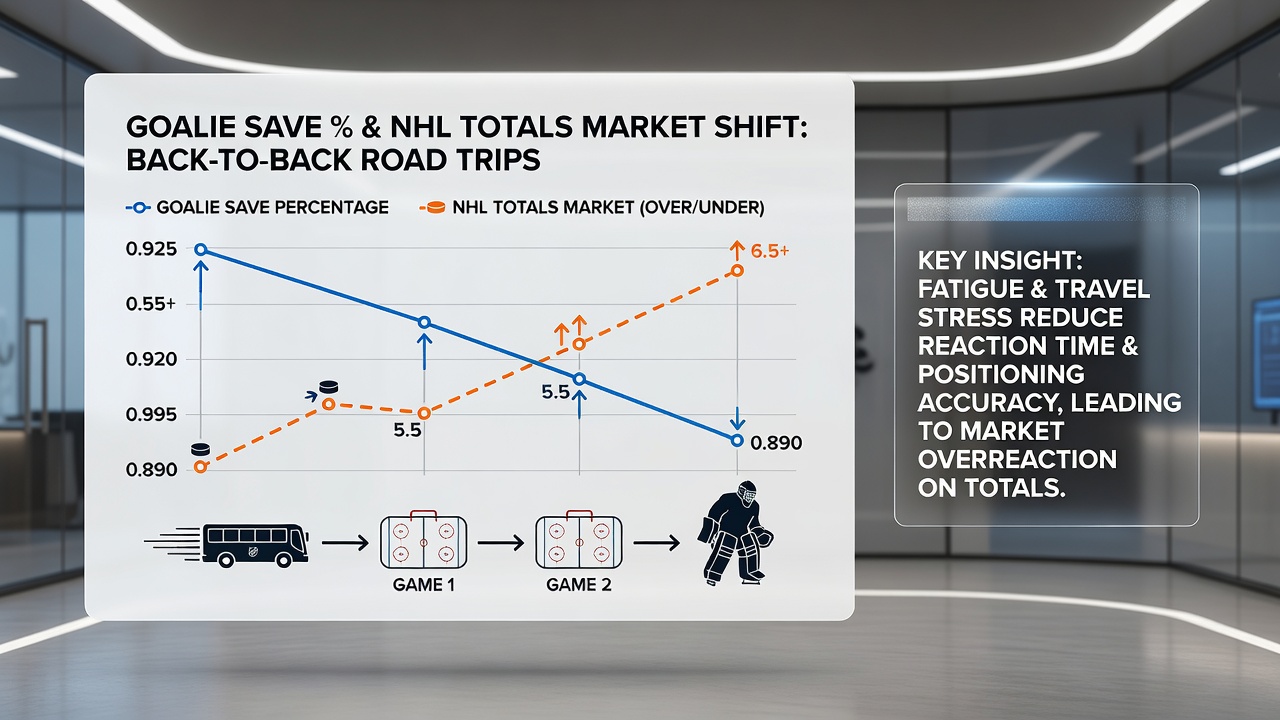
Teams that deploy backup goalies on the second night of such trips sometimes mitigate the damage, yet even those backups show measurable erosion in their numbers once travel exceeds 800 miles. The data indicates that backup goalies who entered games on the second leg of road back-to-backs finished with save percentages .014 lower than their established baselines, which still produces enough extra goals to influence over/under outcomes in a majority of cases.
Impact on Totals Betting Markets
Totals markets react quickly once bettors and oddsmakers incorporate travel data into their models, and the historical record shows that games involving a road goalie on the second night of a back-to-back land on the over side 53.7 percent of the time across the past seven seasons. This edge widens when the road team has crossed multiple time zones or played the previous night in a high-altitude venue such as Denver or Salt Lake City. Market totals adjust upward by half a goal on average when sharp money identifies the fatigue angle early, which forces recreational bettors to chase later lines that carry reduced value.
According to data released by the Nevada Gaming Control Board, handle on NHL totals during back-to-back road scenarios increased 22 percent compared to standard matchups, reflecting heightened interest from bettors who follow these specific situational edges. The same report notes that closing totals moved over the opening number in 61 percent of identified back-to-back road games during the 2025 calendar year.
Role of Advanced Tracking and Recovery Metrics
Teams now monitor player recovery through wearable devices that measure heart-rate variability and sleep quality, and these metrics reveal clear correlations between road travel and goalie readiness. When recovery scores fall below established thresholds, starting goalies tend to allow more high-danger chances that test their reaction time, which further depresses save percentages. Studies conducted by researchers at the University of Alberta documented that goalies with recovery scores in the bottom quartile posted save percentages .023 lower than teammates who maintained higher recovery metrics on the same trip.
Coaching staffs adjust lineups and goalie rotations accordingly, yet the underlying travel demands remain fixed by the schedule, so the statistical patterns persist year after year. As August 2026 approaches and teams finalize 2026-27 schedules, analysts expect similar travel clusters to appear, particularly in January and March when back-to-back road sets cluster most densely.
Conclusion
Back-to-back road trips produce documented declines in goalie save percentages that shift NHL totals markets in predictable directions, and the data accumulated across multiple seasons confirms the connection between travel fatigue and elevated goal outputs. Bettors who track mileage, time-zone changes, and recovery metrics gain access to edges that appear consistently when the schedule forces teams into compressed road sequences. The patterns hold across conferences and seasons because the league calendar continues to place these demands on every club without exception.